Sample report · a walkthrough
This is what you get. Here's how to read it.
A real report on the F1 Singapore Grand Prix, as it was delivered on 14 October 2026. 5 stops, about two minutes. Nothing here is mocked up; every number and quote is from the report.
The whole conversation, in one sentence
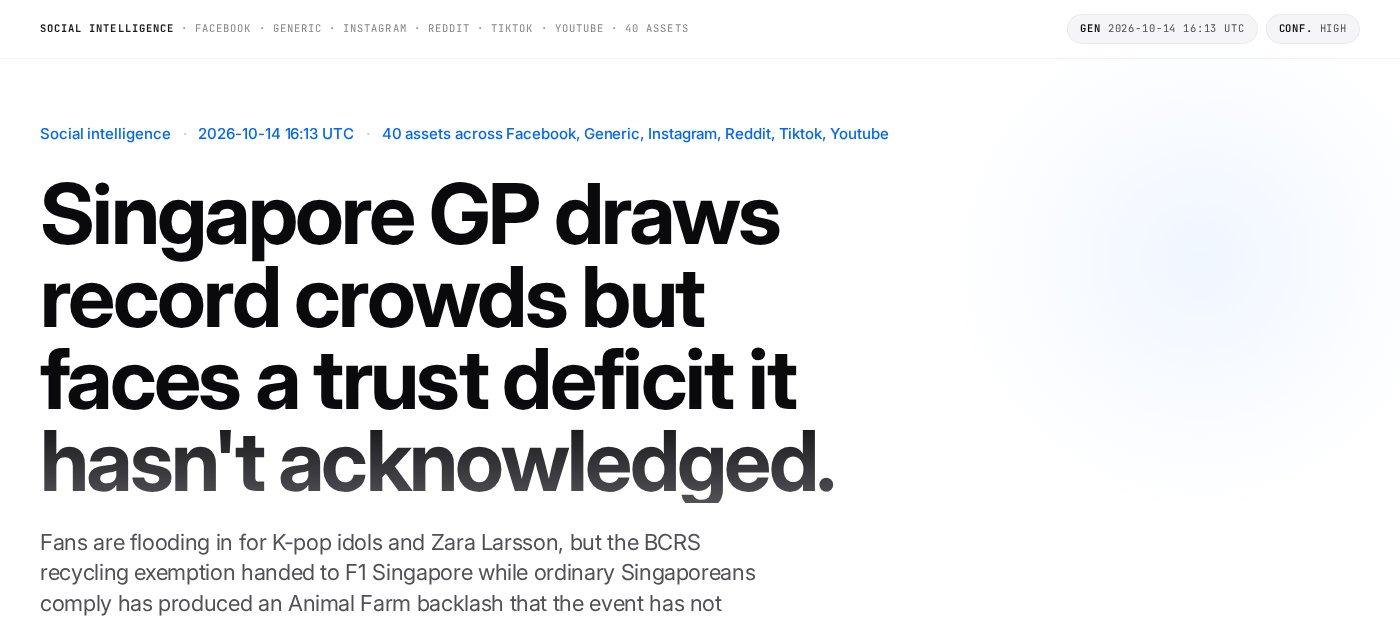
The first thing you see is the finding, not a dashboard.
- aWhen it ran and what it read: 40 public posts across Facebook, TikTok, Instagram, Reddit, YouTube and the news.
- bThe headline is written from the comments, not from a brief. Here: record crowds, and a trust problem underneath that the event hasn't answered.
How much was read, and which way it leans
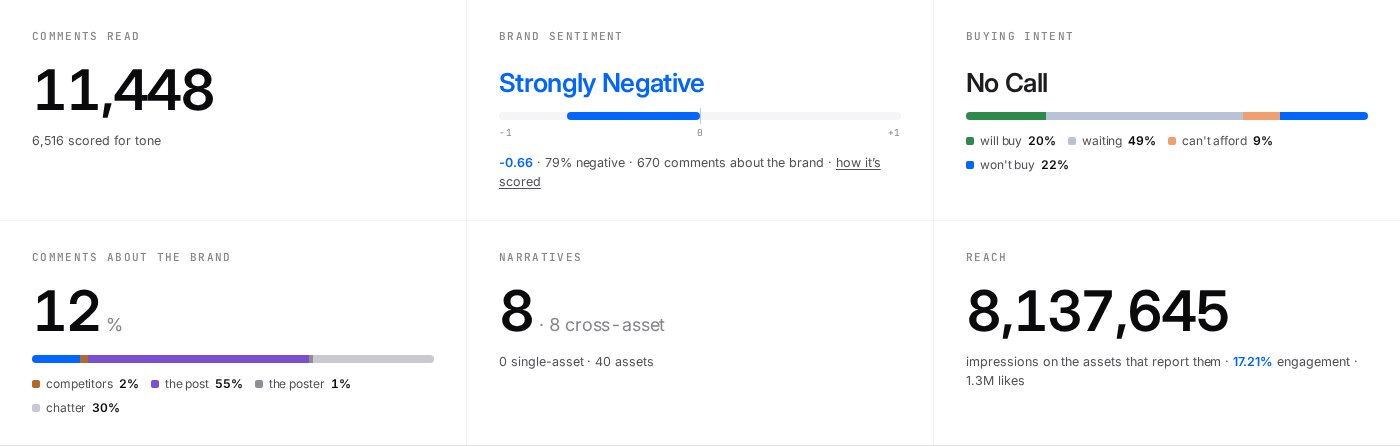
The numbers that tell you whether to trust what follows.
- aAll 11,448 comments were read and sorted into themes. 6,516 of them, a sample from every theme, were also scored for tone.
- bStrongly negative, at −0.66 on a scale from −1 to +1, among the 670 comments about the event itself.
- cBuying intent: who says they'll buy, who's waiting, who can't afford it. Here the split is too even to call.
A paragraph you can lift into your deck
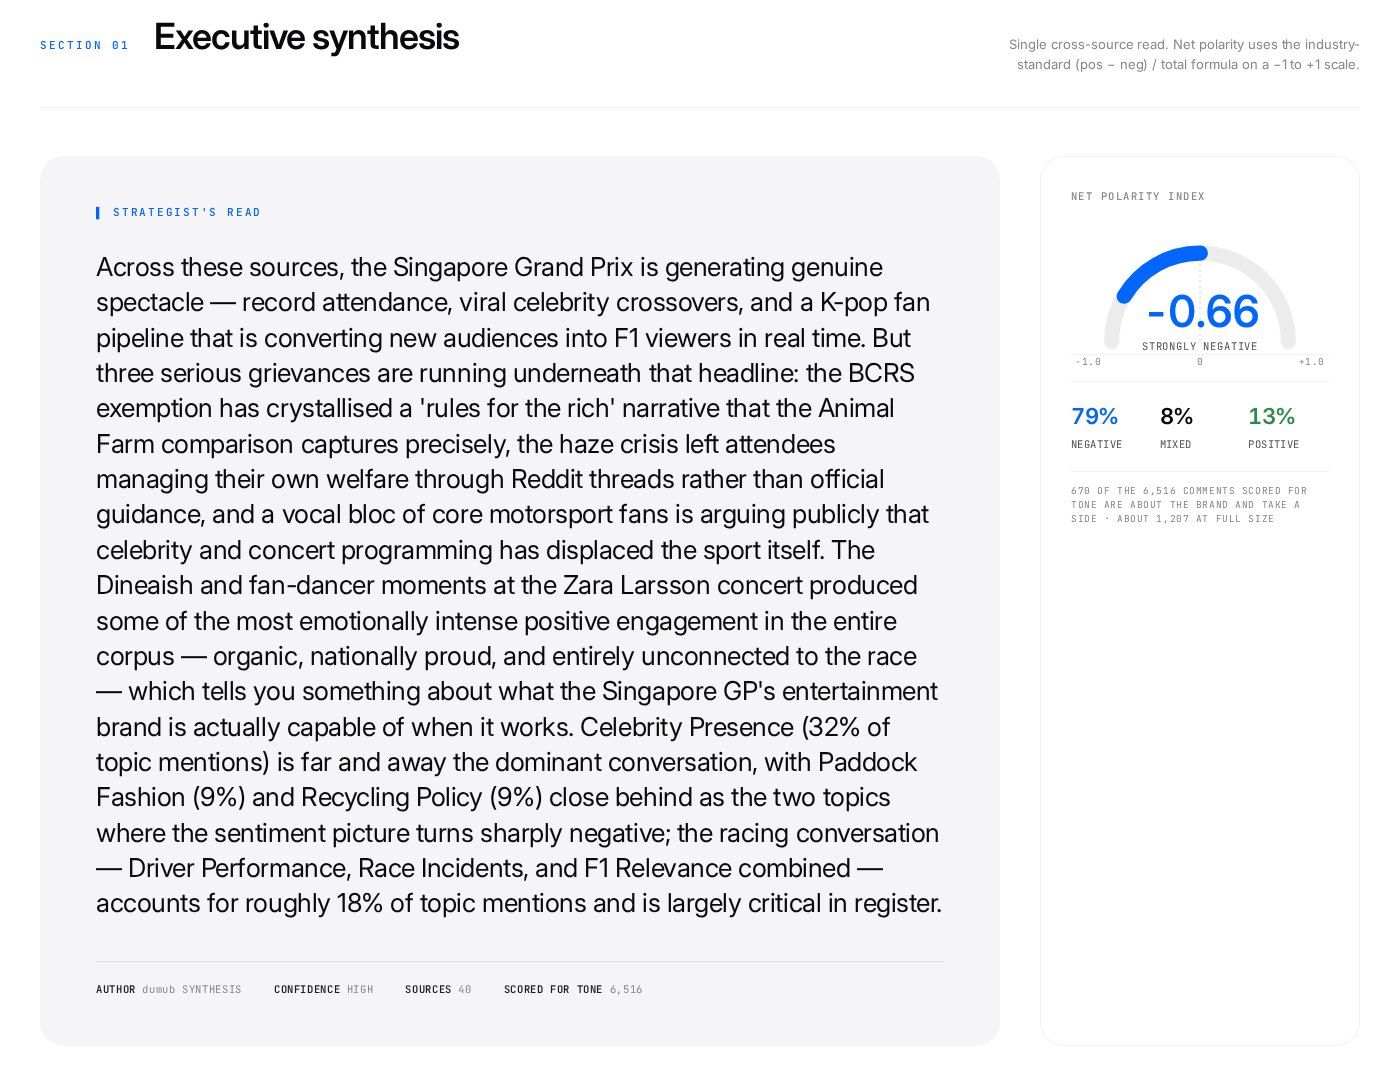
What a strategist would tell you after reading every comment.
- aThe strategist's read: real spectacle and a K-pop fan pipeline on top, and three grievances underneath: the recycling exemption, the haze, and core fans who say the celebrities have pushed the racing aside.
- bThe tone in one gauge: 79% negative, 8% mixed, 13% positive.
How tone is worked out
- Read the post first. Each post is summarised before its comments are touched: what it's about, who it's for, its own tone. “That was insane” means one thing under a crash video and another under a product review.
- Judge each comment in words. Each comment gets a short written judgment of where it stands, in context and in its own language, including sarcasm and in-jokes. No score yet.
- Match it to a fixed scale. That judgment is matched to the closest of five fixed descriptions, from strongly negative (1) to strongly positive (5). The same five descriptions are used on every report, so the model never makes up a number.
- Net it out. Tone is the share of positive comments (4–5) minus the share of negative ones (1–2), from −1 to +1. Here: 13% positive minus 79% negative, about −0.66.
Only tone uses a sample. The themes and their sizes come from all 11,448 comments. Tone is scored on a sample from every theme: all of a theme's comments when it has 30 or fewer, and up to 95 from the biggest. That's enough to pin each theme's tone to within about ten points either way, and small themes get scored as well as big ones. 6,516 were scored here. The posts themselves are scored the same way, which is how the report can say the posts leaned positive and their audiences did not.
What people are actually talking about
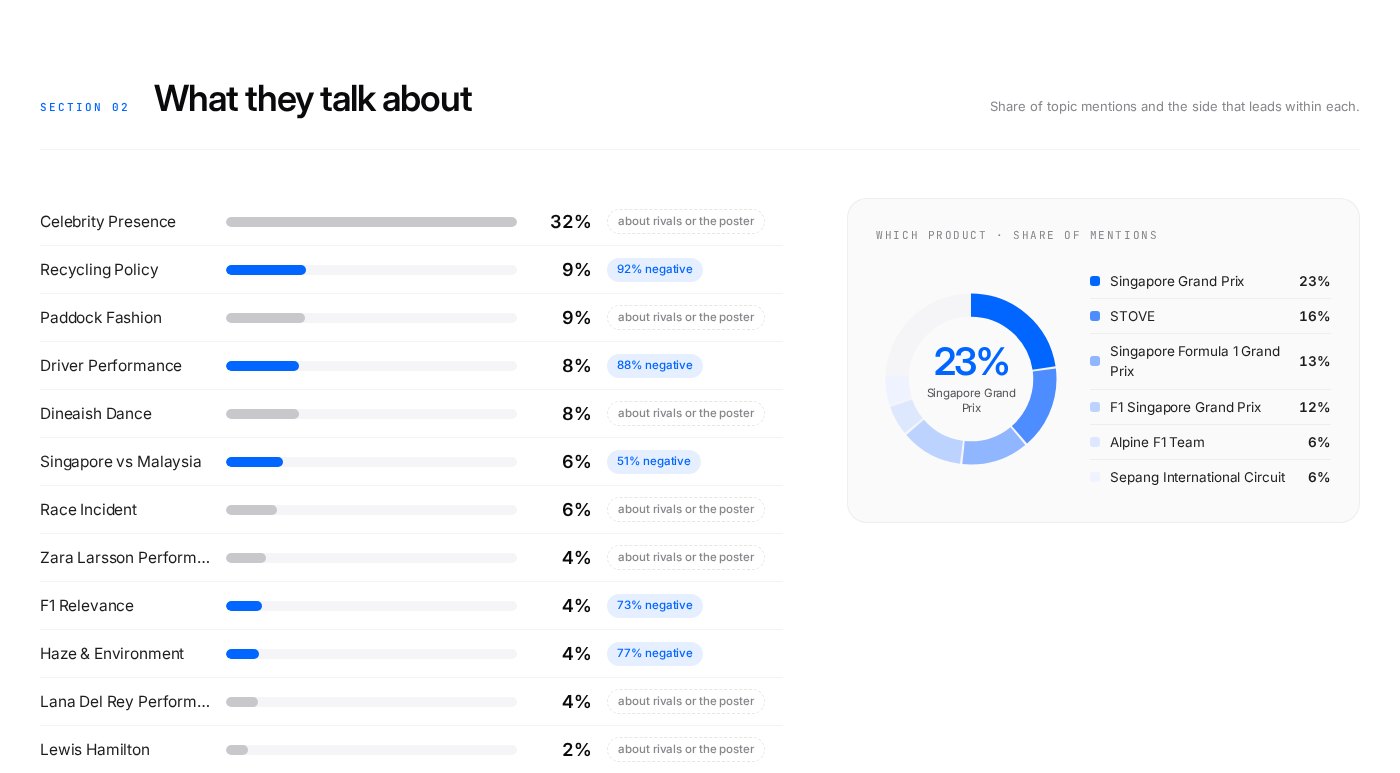
Each topic's share of the conversation, and the side it leans.
- aCelebrity presence is the biggest topic by far: 32% of topic mentions.
- bRecycling policy is only 9% of mentions, but 92% negative.
- cWhich part of the event people talk about: the Singapore Grand Prix itself leads at 23%.
The same report, as slides
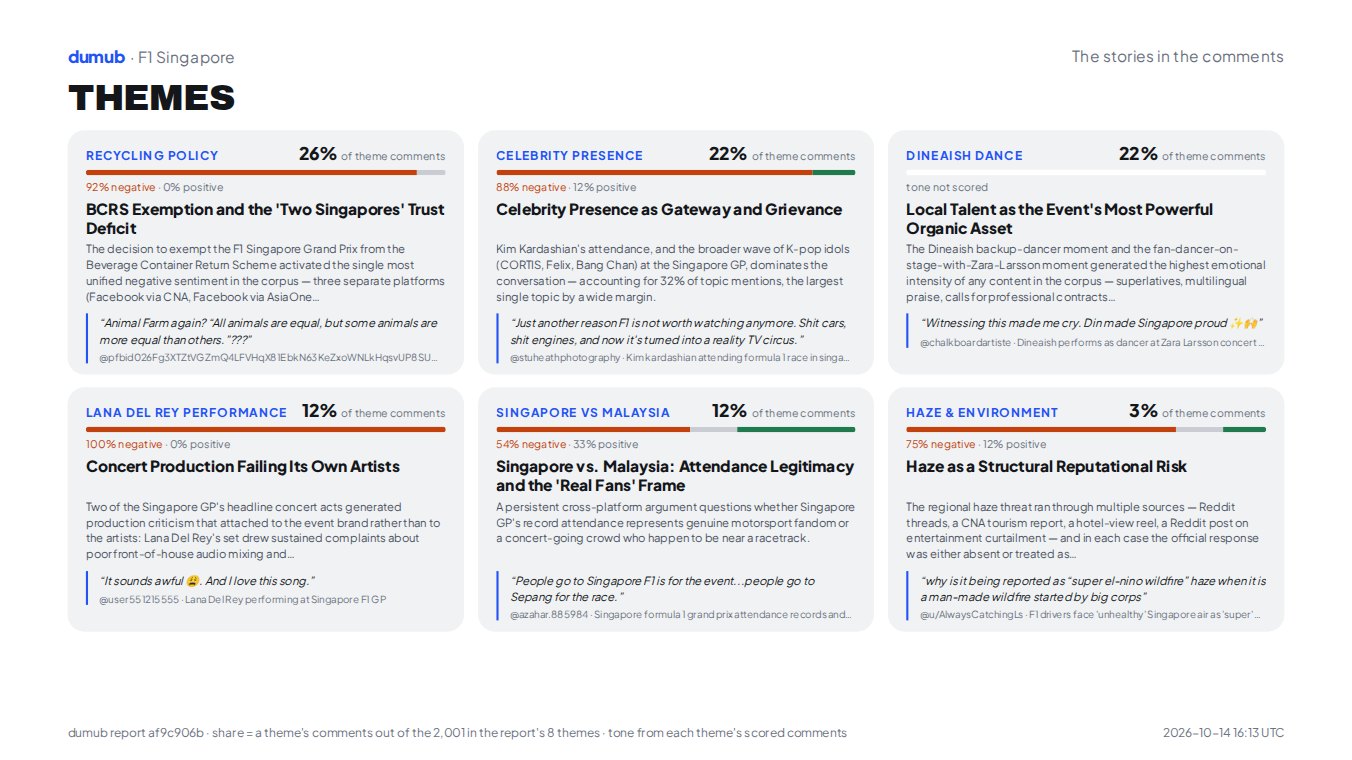
Every report also comes as a three-slide deck: the read, the topics and the themes. This is the third, and it saves as a PDF.
- aEach theme with its share of the themed comments, and how it leans.
- bA theme whose comments weren't scored for tone says so, instead of showing a number.
- cThe footnote says how every share is counted.
Now read the whole thing.
Eight themes, the full source table and the methodology, exactly as delivered. The zip that comes with it adds a deep dive per source, every comment in a spreadsheet, and the slides.