Sample report · a walkthrough
This is what you get. Here's how to read it.
A real report on Singapore Airlines' new cabins, as it was delivered on 12 November 2026. 6 stops, about two minutes. Nothing here is mocked up; every number and quote is from the report.
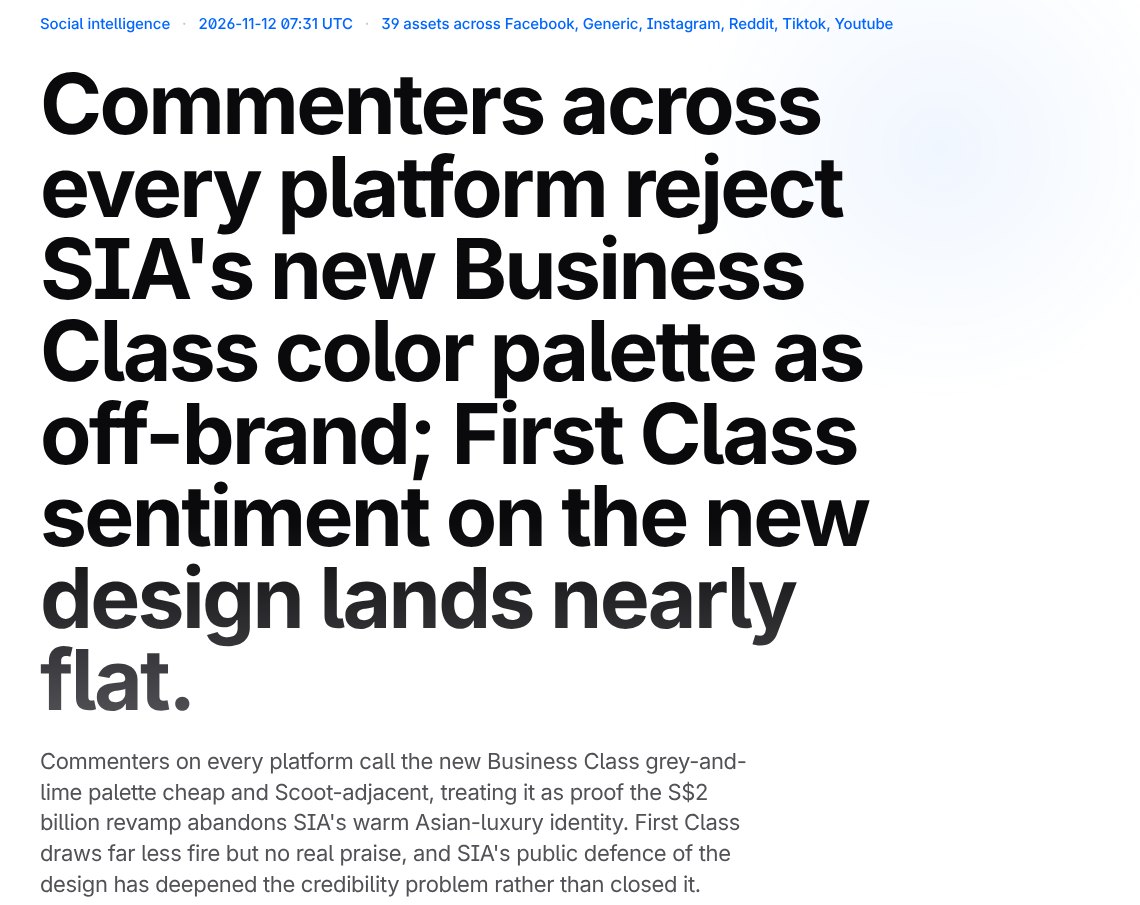
The whole conversation, in one sentence
The first thing you see is the finding, not a dashboard.
- aWhen it ran and what it read: 39 public posts and articles across Instagram, TikTok, YouTube, Reddit, Facebook and the web.
- bThe headline is written from the comments, not from a brief. Here: the Business Class colours are the problem, and First Class lands close to even.
- cThe paragraph under it names what people compare it to: Scoot, SIA's own budget airline.
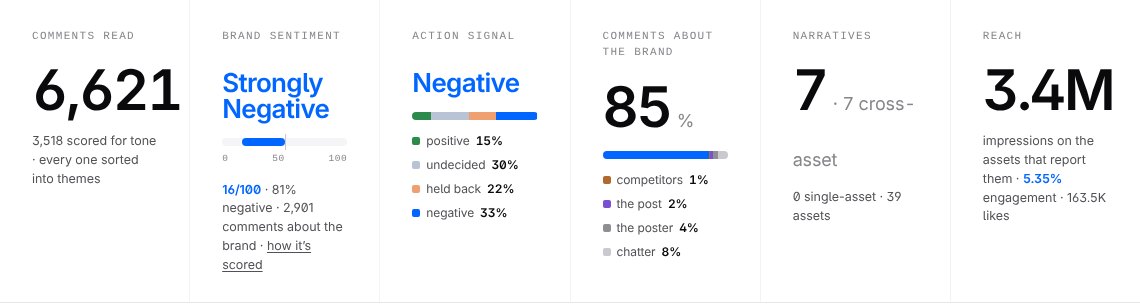
How much was read, and which way it leans
The numbers that tell you whether to trust what follows.
- aAll 6,621 comments were read and sorted into themes. 3,518 of them, a sample from every theme, were also scored for tone.
- bStrongly negative: 16 out of 100, where 50 is even, among the 2,901 scored comments that are about SIA itself.
- cAction signal: what people say they'll do. More lean away (33%) than toward (15%).
- d85% of the comments are about SIA. The rest are about the video, the creator, other airlines or nothing much, and they don't count toward SIA's tone.
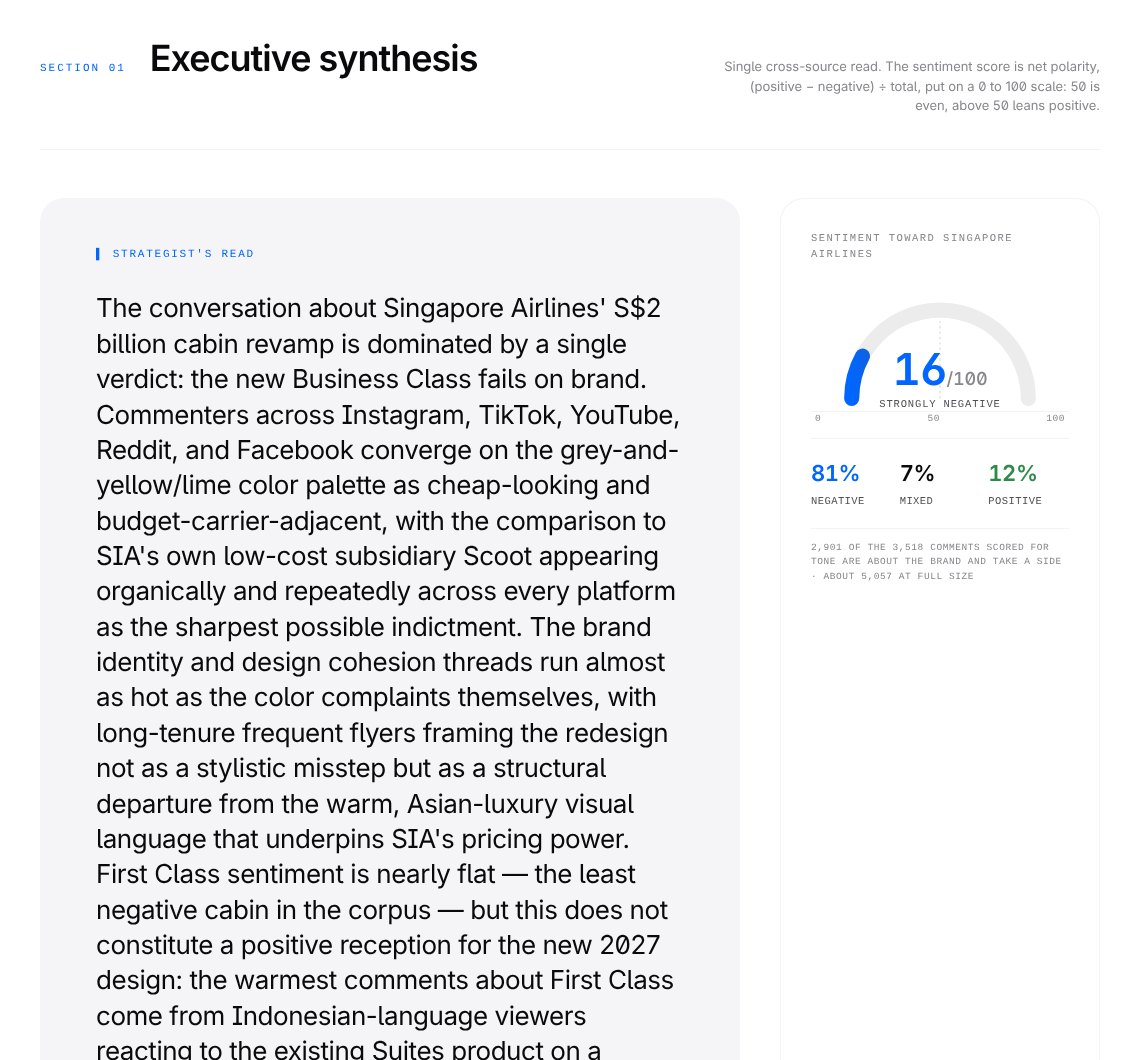
A paragraph you can lift into your deck
What a strategist would tell you after reading every comment.
- aThe strategist's read: one verdict, the new Business Class fails on brand, and the Scoot comparison turning up on every platform as the sharpest version of it.
- bThe tone in one gauge: 16 out of 100. 81% negative, 7% mixed, 12% positive.
How tone is worked out
- Read the post first. Each post is summarised before its comments are touched: what it's about, who it's for, its own tone. “That was insane” means one thing under a crash video and another under a product review.
- Judge each comment in words. Each comment gets a short written judgment of where it stands, in context and in its own language, including sarcasm and in-jokes. No score yet.
- Match it to a fixed scale. That judgment is matched to the closest of five fixed descriptions, from strongly negative (1) to strongly positive (5). The same five descriptions are used on every report, so the model never makes up a number.
- Net it out. Tone is the share of positive comments (4–5) minus the share of negative ones (1–2), put on a scale from 0 to 100 where 50 is even. Here: 12% positive and 81% negative comes to 16.
Only tone uses a sample. The themes and their sizes come from all 6,621 comments. Tone is scored on a sample from every theme: all of a theme's comments when it has 30 or fewer, and up to 95 from the biggest, so small themes get scored as well as big ones. 3,518 were scored here. The posts themselves are scored the same way, so the report can tell a post's own tone apart from its audience's.
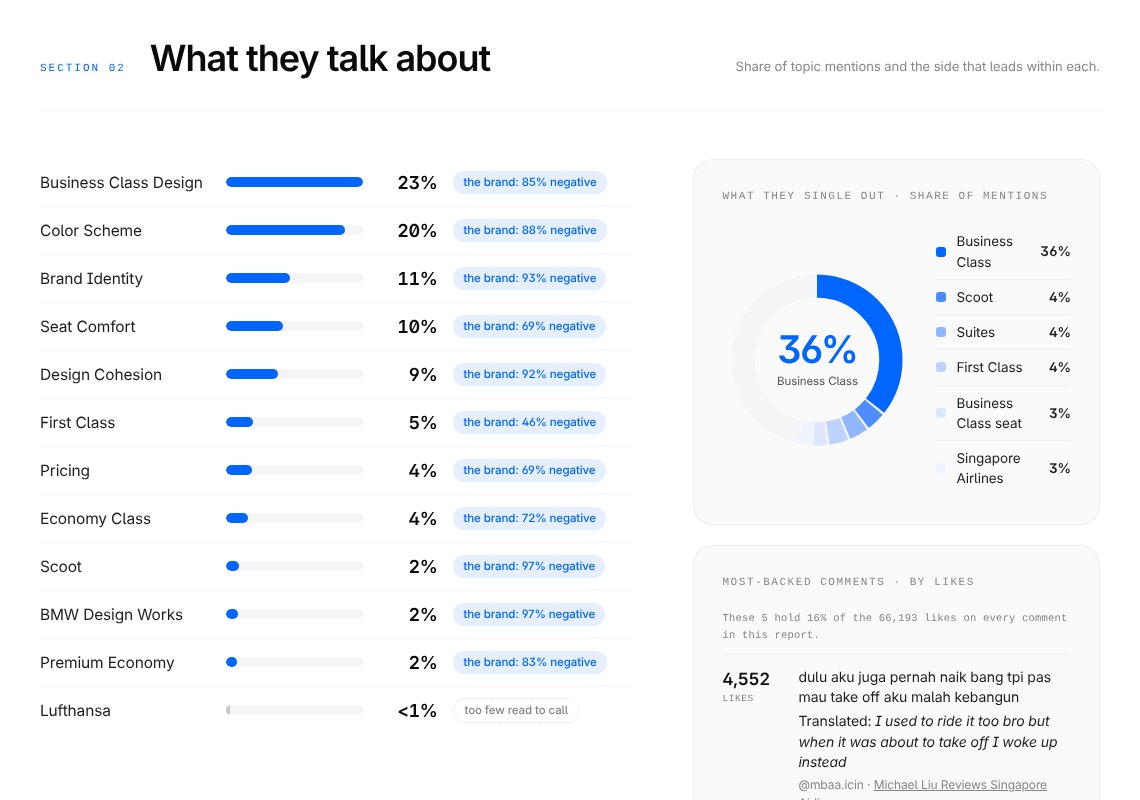
What people are actually talking about
Each topic's share of the conversation, and the side it leans.
- aBusiness Class design and its colour scheme are the two biggest topics: 43% of mentions between them.
- bBrand identity is smaller, 11%, but the most one-sided: 93% negative.
- cWhat people single out by name: after Business Class itself, the next is Scoot.
Every theme, with the comments behind it
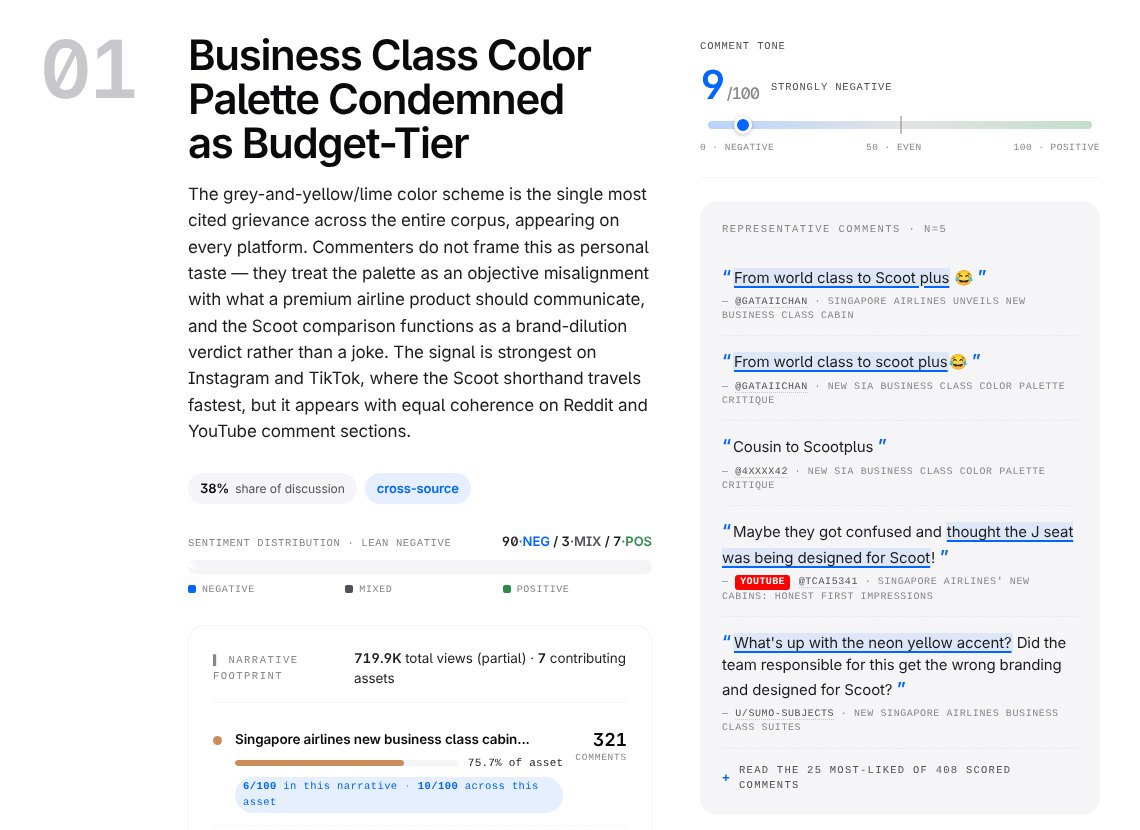
Seven themes, ranked by how many comments carry them. This is the biggest.
- aThe theme, named from what the comments say: the palette reads as budget-tier.
- bIts tone: 9 out of 100, strongly negative.
- cIts size: 38% of the themed comments, and it shows up on every platform, not one viral post.
- dThe comments behind it, linked to where they were posted.
The same report, as slides
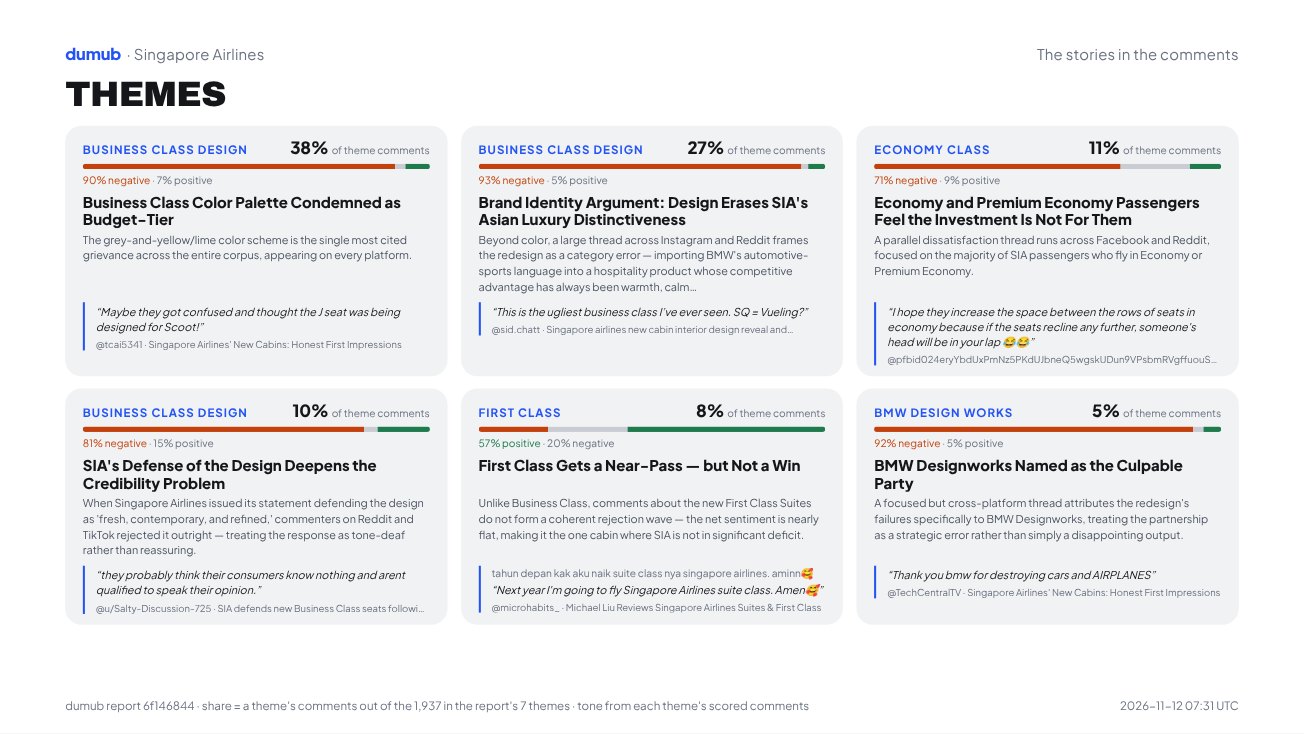
Every report also comes as a three-slide deck: the read, the topics and the themes. This is the third, and it saves as a PDF.
- aEach theme with its share of the themed comments, and how it leans.
- bThe split inside each theme: here 90% negative, 7% positive.
- cThe footnote says how every share is counted.
Now read the whole thing.
Seven themes, the market voices, every source and the methodology, exactly as delivered, with the question box open. Ask it something.